One of the best pieces of investment advice could be, “It’s not what you earn, it’s what you keep that matters.” As such, active tax management is a key piece of portfolio management. And many investors use a variety of techniques and strategies to keep Uncle Sam out of their pockets. But one strategy is often underappreciated by many investors no matter what their tax bracket is.
And that’s the taxable equivalent yield on municipal bonds.
Munis provide many tax advantages over taxable bonds such as U.S. Treasuries and corporates, chief of which is their ability to provide tax-advantaged and tax-free income. Often, investors ignore the real after-tax yield when building their fixed income portfolios. And that’s a shame as, more often than not, munis win out on yield.
Tax-Free Interest
Municipal bonds and debt are IOUs issued by states, local governments, and their agencies. Proceeds from these bonds can be used for a variety of purposes, such as special projects like light rail or the generalized funding of government operations. To help spur state/local investment, Uncle Sam has been giving investors a break on taxes since 1913. The idea behind this tax exemption was to help state and local governments enjoy a lower cost of capital for their funding and borrowing needs.
Aside from a smaller sliver of bonds that are subject to the alternate minimum tax (AMT), most munis are free from federal taxes. And if the bond is issued by the investor’s home state, that tax break extends itself into state and local taxes as well.
This exemption on interest has been a key feature of municipal bonds, and they have long been a portfolio holding for many high-net-worth family, insurance, and institutional portfolios.
Taxable Equivalent Yield
However, for many investors, munis are often ignored completely and are simply written off as an asset class for the rich. The reason? Their headline yields are paltry.
Looking at the latest data from Nuveen shows that the Bloomberg Municipal Bond Index—which is a benchmark of investment-grade municipal bonds not subject to the AMT—is paying a current yield of 3.7%. That’s not too bad until you compare it to other fixed income asset classes. For example, Nuveen’s data shows that investment-grade corporate bonds are yielding 5.5%, junk is paying 7.9%, and Treasuries are paying 4.6%. Looking at the Bloomberg Bond Aggregate index, we have an average yield of 5%.
Earning 5% is better than earning just 3.7%. With that, investors often skip munis in favor of other bonds. But by doing this, many investors are ignoring a powerful benefit of munis.
And that would be their taxable equivalent yield (TEY).
A TEY is essentially a return calculation that puts a taxable bond and tax-exempt muni on equal footing. It’s what you would have to earn on a taxable bond such as an IG corporate or mortgage-backed security to make the same after-tax rate on a muni. This calculation is key in the investment decision and often investors don’t fully appreciate its power when selecting their bond investments.
In practice, it works like this. For someone in the top federal tax rate of 40.8%—37% tax rate plus the 3.8% Obamacare surcharge—that low investment-grade muni yield jumps to a TEY of 6.3%. That means an investor would have to earn more than 6.3% before taxes to come out ahead of the muni on income generation.
Investors could do that by going into junk bonds, but then they would be taking on much more risk. When it comes to credit quality, munis often sit just below Uncle Sam in terms of rating. That’s because a state or local government can raise taxes to help pay for their debts. As such, most munis feature high investment-grade ratings. And in fact, many outrank investment-grade corporate bonds on credit quality.
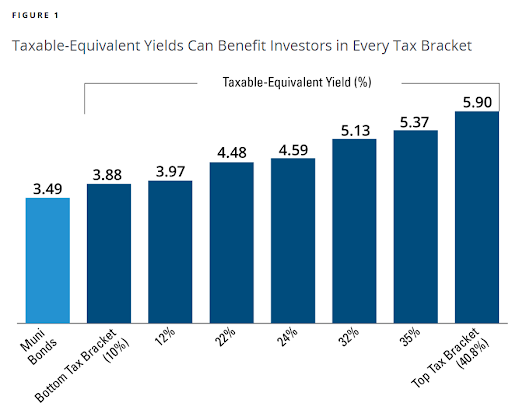
The best piece is that when looking at TEY, the vast bulk of investors still come out ahead with munis compared to other bond varieties. This chart from Hartford Funds shows how much a TEY would be for investors in different tax brackets.

Source: Hartford Funds
With this, you can see that munis still offer plenty of attractive income for investors no matter their tax bracket.
Perhaps the best piece is the TEY benefit grows as bond yields rise. For example, a 1% municipal yield increases by just 0.7% on a tax-equivalent basis. However, a 5% municipal yield increases the TEY by 3.4%. With the Fed potentially pausing its rate-cutting path, this fact is beneficial for investors in lower tax brackets. The data from Hartford’s chart was taken in September.
Already, muni yields have risen as noted by the data provided by Nuveen a few paragraphs ago.
Investors in lower brackets are now getting more income tax-free versus taxable bonds.
Focusing on Taxable Equivalent Yield
Looking strictly at headlines puts many investors—no matter their tax bracket—at risk for lower returns and income potential. Ignoring a TEY calculation in building a bond portfolio can result in lower after-tax income potential.
Another issue? Wasting space in a tax-deferred or tax-free account on bonds versus high-growth assets like equities. Many investors could potentially have better long-term after-tax returns by using munis in a taxable account and using their IRA/401k space for equities. This is beneficial for investors in lower tax brackets who can take tax advantage of Roth accounts.
Overall, munis and their ability to generate tax-free income at high credit quality should not be ignored by most investors. Getting that exposure remains the realm of funds and ETFs. Buying individual munis is still a tough nut to crack and requires large investment minimums. ETFs make short work of municipal bonds and can be quickly used to add exposure.
Municipal Bond ETFs
These funds were selected based on their exposure to municipal bonds at a low cost. They are sorted by their YTD total return, which ranges from 2.3% to 5%. They have expense ratios between 0.05% to 0.65% and have assets under management between $930M to $34B. They are currently offering yields between 1.5% and 4.1%.
| Ticker | Name | AUM | 1-year Total Ret (%) | Yield (%) | Exp Ratio | Security Type | Actively Managed? |
|---|---|---|---|---|---|---|---|
| FMB | First Trust Managed Municipal ETF | $1.8B | 5% | 2.98% | 0.65% | ETF | Yes |
| MUNI | PIMCO Intermediate Municipal Bond Active ETF | $1B | 4.9% | 3.4% | 0.35% | ETF | Yes |
| VTEB | Vanguard Tax-Exempt Bond ETF | $29B | 4.4% | 2.79% | 0.05% | ETF | No |
| MUB | iShares National Muni Bond ETF | $34B | 4.3% | 2.64% | 0.05% | ETF | No |
| DFNM | Dimensional National Municipal Bond ETF | $933M | 3.1% | 4.1% | 0.19% | ETF | Yes |
| SHM | SPDR Nuveen Bloomberg Short Term Municipal Bond ETF | $3.9B | 2.4% | 1.5% | 0.20% | ETF | No |
| SUB | iShares Short-Term National Muni Bond ETF | $8.8B | 2.3% | 1.74% | 0.07% | ETF | No |
In the end, a TEY is a powerful tool that most investors ignore. By using it, they can compare municipal bonds to many bond varieties. And it turns out munis often come ahead. With strong credit quality and better after-tax yields than most bonds, munis shouldn’t be ignored by investors of any tax bracket.
Bottom Line
Municipal bonds are often ignored by investors in lower tax brackets due to their poor headline yields. However, investors are ignoring the benefit of a TEY and muni’s high overall income when factoring in what we owe Uncle Sam. Here, it often makes sense to buy munis over other bonds.


